6 Environmental Monitors

Continuous environmental observation over long periods of time is an important basis of Earth system research. It’s an important tool to distinguish short-term events from long-term trends. Most of the observation data flow directly into scientific research. Using and processing continuously incoming observational data, however, is also an opportunity to visualize current environmental developments of public interest, e.g. on droughts, storm surges or earthquakes. Helmholtz Research Field Earth and Environment provides several such environmental monitors, a selection of which can be accessed by the links below.

Vertrocknetes Sonnenblumenfeld
© UFZ/André Künzelmann

The Drought Monitor

The UFZ drought monitor provides comprehensive information on the state of soil moisture in Germany on a daily basis. The maps for the daily updated drought status of the overall soil, the topsoil and the water available to plants in the soil are also available for download.

Abgestorbene Fichten von oben
© UFZ/André Künzelmann

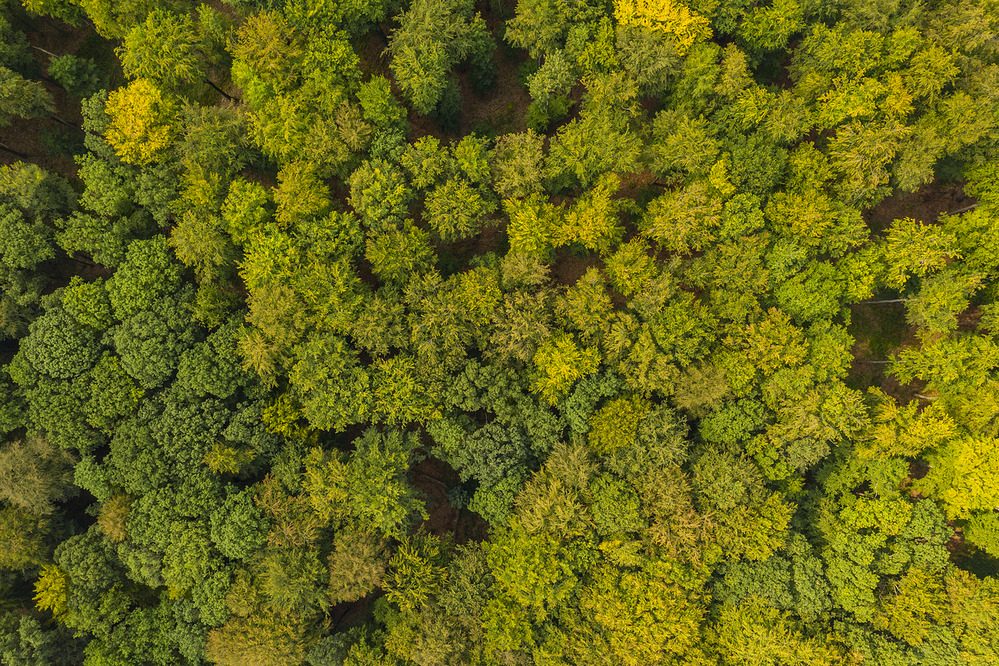
The Renewable Energy Monitor

The EE-Monitor of UFZ and the German Biomass Research Centre provides high-resolution information on nature compatibility of the energy transition in Germany. Based on 41 key figures, the current status of the expansion of renewable energies (RE) in Germany is described. The RE Monitor helps to identify both undesirable developments and positive trends.

Vier Windräder in der Landschaft
©abby anaday unsplash

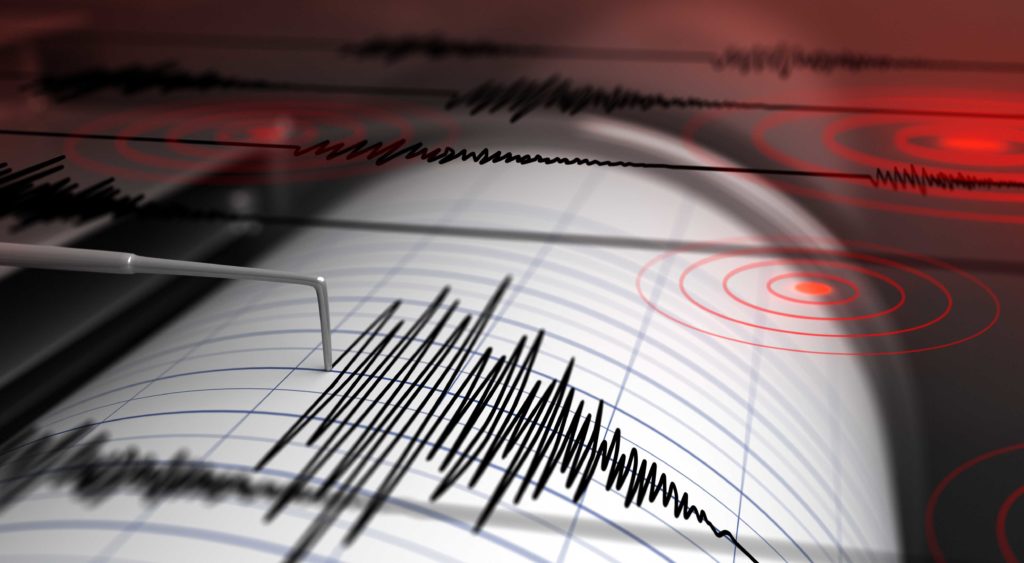
The Earthquake Explorer

The “Earthquake Explorer” is offered by the GFZ’s GEOFON earthquake service. GEOFON aims to facilitate collaboration in seismological research and earthquake and tsunami risk mitigation by providing fast transnational access to seismological data and source parameters of large earthquakes and keeping these data accessible over the long term. In addition to the data, the Explorer offers processing via maps.

Seismografische Aufzeichnung eines Erdbebens
© Andrey VP AdobeStock

The Sea Ice Portal

The “meereisportal.de” website provides scientific information and data on the subject of sea ice, as well as background information on changes in sea ice occurrence and their causes. Maps updated daily show sea ice coverage in the Arctic and Antarctic Oceans. The sea ice portal is an initiative of the Helmholtz Association REKLIM, the University of Bremen and the Alfred Wegener Institute.

Meereis von oben
© AWI/Stefan Hendricks

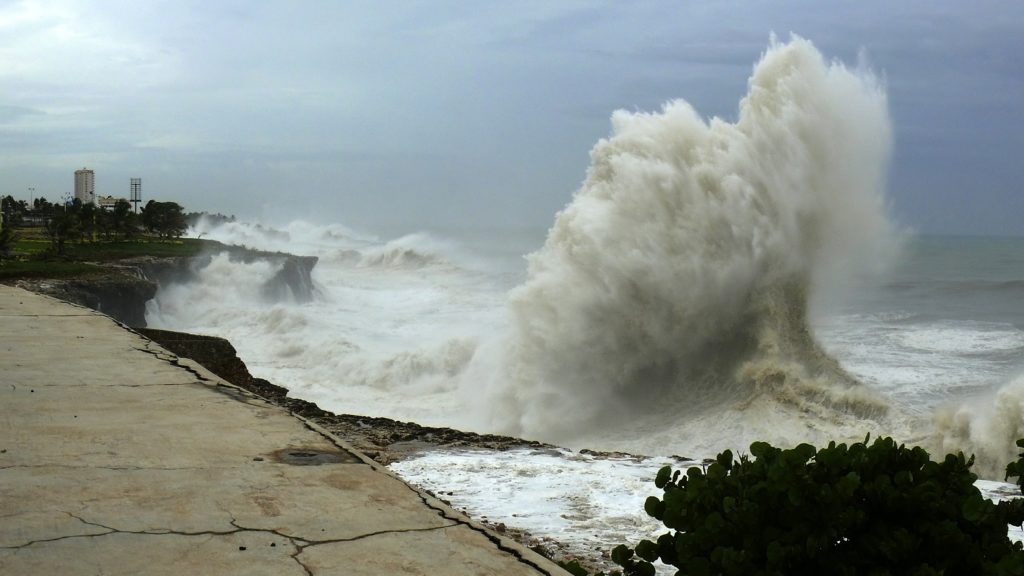
The Coastal Protection Monitor

The Hereon Coastal Protection Monitor shows which coasts in Germany need to be protected against floods and storm surges. Interactive maps illustrate whether a person’s home, place of work or tourist destination needs additional protection against rising sea levels.

Hohe Flutwelle an der Küste
© Xavier Rodríguez/Fotolia

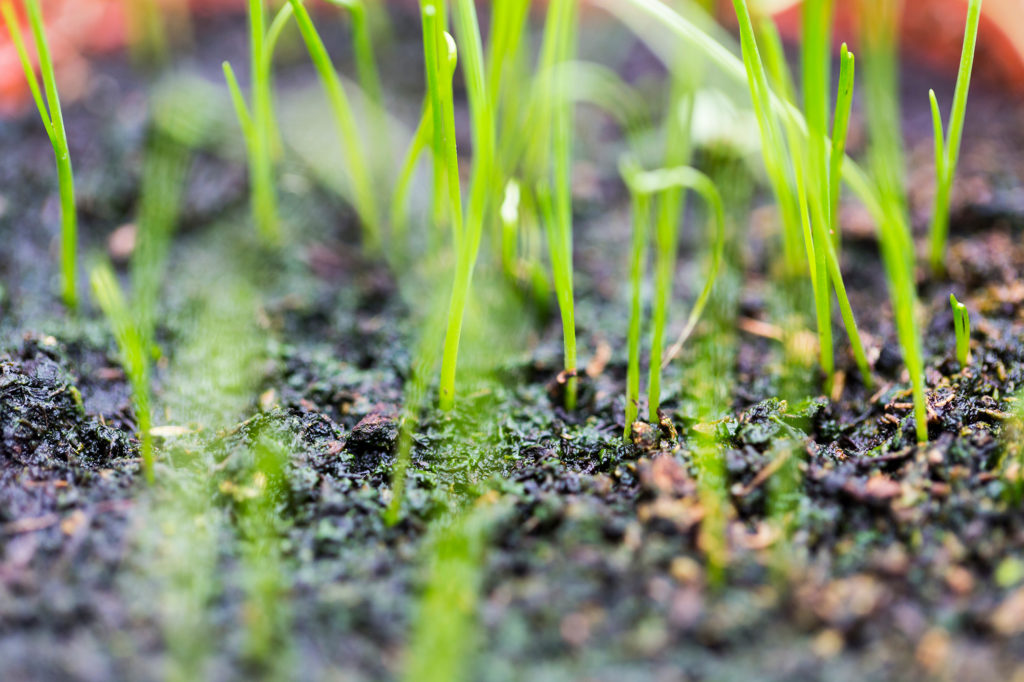
The Water Monitor

The water monitor from Forschungszentrum Jülich provides an overview of the water balance in the soil with a very high spatial resolution of around 600 meters for all of Germany and neighboring areas. In this way, it can be read for a period of up to nine days into the future whether the soil has enough water for plants.

Pflanzen wachsen auf Boden
© FZJ/Ralf-Uwe Limbach

Datahub Earth and Environment

The data hub of the Research Field Earth and Environment, does also provide these and other data products in visually somewhat different map views.

Would you like to know more about the Helmholtz Association, the other research centers and other research areas?

Helmholtz Association